\(\renewcommand{\AA}{\text{Å}}\)
7.2. Measuring performance
7.2.1. Factors that influence performance
Before trying to make your simulation run faster, you should understand how it currently performs and where the bottlenecks are. We generally distinguish between serial performance (how fast can a single process do the calculations?) and parallel efficiency (how much faster does a calculation get by using more processes?). There are many factors affecting either and below are some lists discussing some commonly known but also some less known factors.
Factors affecting serial performance (in no specific order):
CPU hardware: clock rate, cache sizes, CPU architecture (instructions per clock, vectorization support, fused multiply-add support and more)
RAM speed and number of channels that the CPU can use to access RAM
Cooling: CPUs can change the CPU clock based on thermal load, thus the degree of cooling can affect the speed of a CPU. Sometimes even the temperature of neighboring compute nodes in a cluster can make a difference.
Compiler optimization: most of LAMMPS is written to be easy to modify and thus compiler optimization can speed up calculations. However, too aggressive compiler optimization can produce incorrect results or crashes (during compilation or at runtime).
Source code improvements: styles in the OPT, OPENMP, and INTEL package can be faster than their base implementation due to improved data access patterns, cache efficiency, or vectorization. Compiler optimization is required to take full advantage of these.
Number and kind of fixes, computes, or variables used during a simulation, especially if they result in collective communication operations
Pair style cutoffs and system density: calculations get slower the more neighbors are in the neighbor list and thus for which interactions need to be computed. Force fields with pair styles that compute interactions between triples or quadruples of atoms or that use embedding energies or charge equilibration will need to walk the neighbor lists multiple times.
Neighbor list settings: tradeoff between neighbor list skin (larger skin = more neighbors, more distances to compute before applying the cutoff) and frequency of neighbor list builds (larger skin = fewer neighbor list builds).
Proximity of per-atom data in physical memory that for atoms that are close in space improves cache efficiency (thus LAMMPS will by default sort atoms in local storage accordingly)
Using r-RESPA multi-timestepping or a SHAKE or RATTLE fix to constrain bonds with higher-frequency vibrations may allow a larger (outer) timestep and thus fewer force evaluations (usually the most time consuming step in MD) for the same simulated time (with some tradeoff in accuracy).
Factors affecting parallel efficiency (in no specific order):
Bandwidth and latency of communication between processes. This can vary a lot between processes on the same CPU or physical node and processes on different physical nodes and there vary between different communication technologies (like Ethernet or InfiniBand or other high-speed interconnects)
Frequency and complexity of communication patterns required
Number of “work units” (usually correlated with the number of atoms and choice of force field) per MPI-process required for one time step (if this number becomes too small, the cost of communication becomes dominant).
Choice of parallelization method (MPI-only, OpenMP-only, MPI+OpenMP, MPI+GPU, MPI+GPU+OpenMP)
Algorithmic complexity of the chosen force field (pair-wise vs. many-body potential, Ewald vs. PPPM vs. (compensated or smoothed) cutoff-Coulomb)
Communication cutoff: a larger cutoff results in more ghost atoms and thus more data that needs to be communicated
Frequency of neighbor list builds: during a neighbor list build the domain decomposition is updated and the list of ghost atoms rebuilt which requires multiple global communication steps
FFT-grid settings and number of MPI processes for kspace style PPPM: PPPM uses parallel 3d FFTs which will drop much faster in parallel efficiency with respect to the number of MPI processes than other parts of the force computation. Thus using MPI+OpenMP parallelization or run style verlet/split can improve parallel efficiency by limiting the number of MPI processes used for the FFTs.
Load (im-)balance: LAMMPS’ domain decomposition assumes that atoms are evenly distributed across the entire simulation box. If there are areas of vacuum, this may lead to different amounts of work for different MPI processes. Using the processors command to change the spatial decomposition, or MPI+OpenMP parallelization instead of only-MPI to have larger sub-domains, or the (fix) balance command (without or with switching to communication style tiled) to change the sub-domain volumes are all methods that can help to avoid load imbalances.
7.2.2. Examples comparing serial performance
Before looking at your own input deck(s), you should get some reference
data from a known input so that you know what kind of performance you
should expect from your input. For the following we therefore use the
in.rhodo.scaled input file and data.rhodo data file from the
bench folder. This is a system of 32000 atoms using the CHARMM force
field and long-range electrostatics running for 100 MD steps. The
performance data is printed at the end of a run and only measures the
performance during propagation and excludes the setup phase.
Running with a single MPI process on an AMD Ryzen Threadripper PRO 9985WX CPU (64 cores, 128 threads, base clock: 3.2GHz, max. clock 5.4GHz, L1/L2/L3 cache 5MB/64MB/256MB, 8 DDR5-6400 memory channels) one gets the following performance report:
Performance: 1.232 ns/day, 19.476 hours/ns, 7.131 timesteps/s, 228.197 katom-step/s
99.2% CPU use with 1 MPI tasks x 1 OpenMP threads
The %CPU value should be at 100% or very close. Lower values would be an indication that there are other processes also using the same CPU core and thus invalidating the performance data. The katom-step/s value is best suited for comparisons, since it is fairly independent from the system size. The in.rhodo.scaled input can be easily made larger through replication in the three dimensions by settings variables “x”, “y”, “z” to values other than 1 from the command line with the “-var” flag. Example:
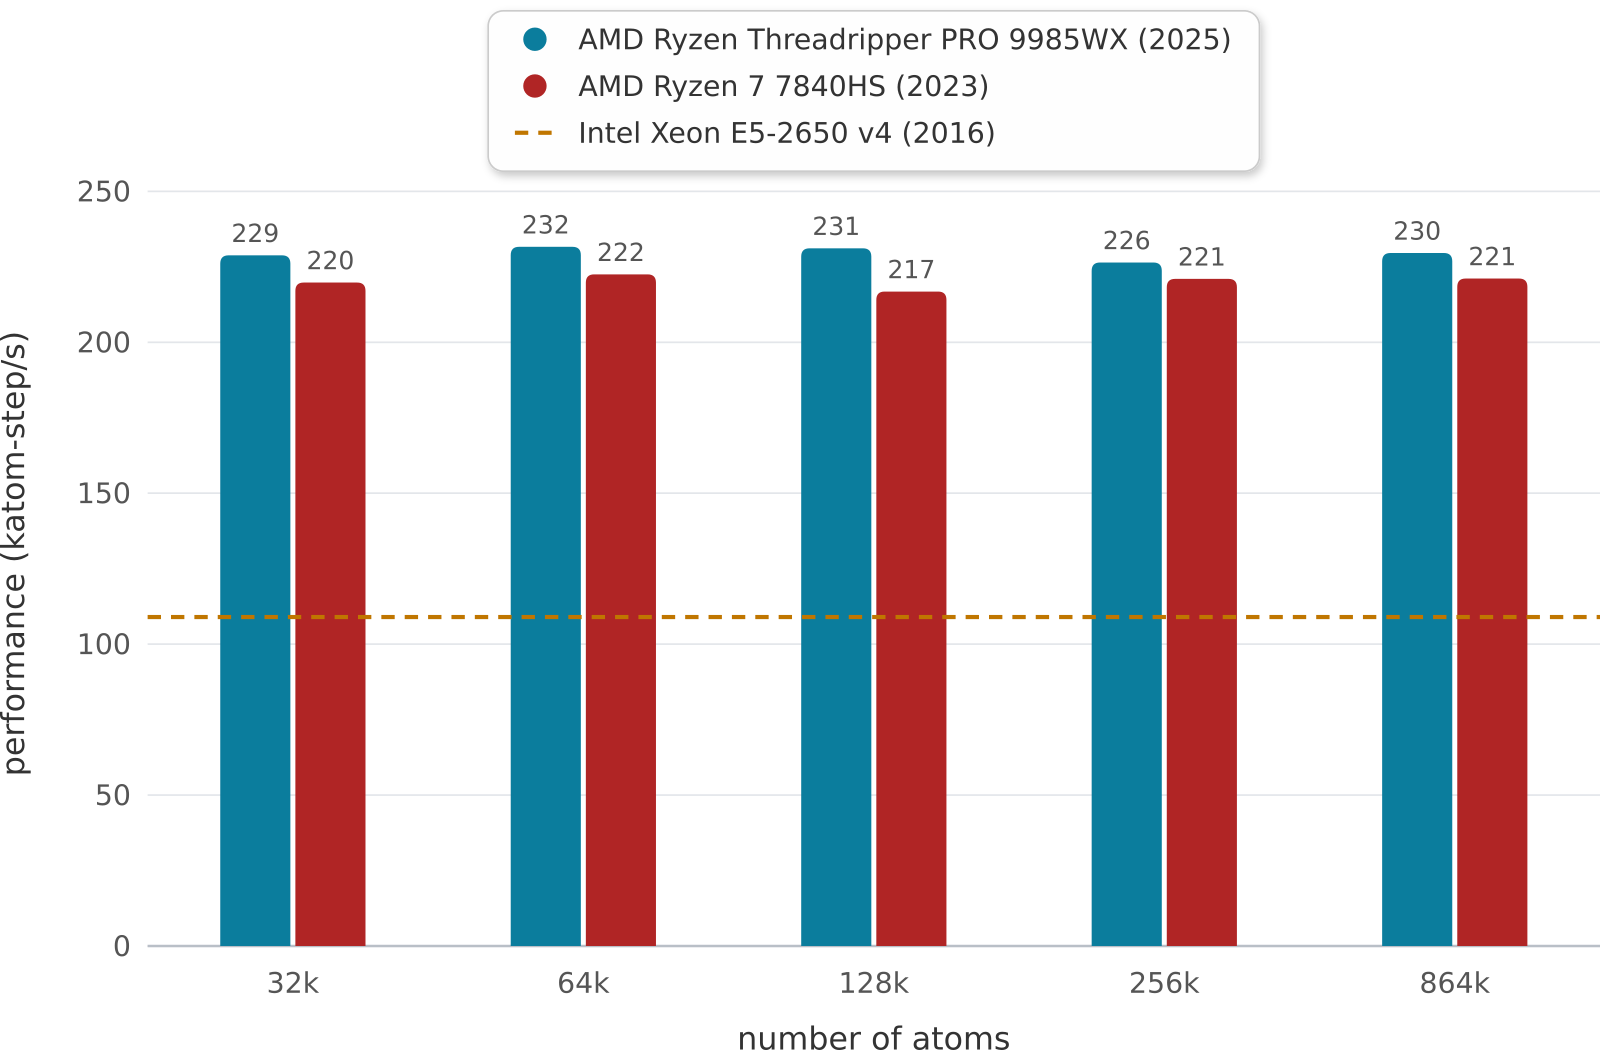
32000 atoms: 228.8 katom-step/s
64000 atoms: 231.6 katom-step/s
128000 atoms: 231.1 katom-step/s
256000 atoms: 226.4 katom-step/s
864000 atoms: 229.6 katom-step/s
Comparing to an AMD Ryzen 7 7840HS CPU (8 cores, 16 threads, base clock 3.8GHz, max. clock 5.1GHz, L1/L2/L3 cache 512kB/8MB/16MB, 2 DDR5-5600 memory channels), we get similar single core performance (~220 katom-step/s vs. ~230 katom-step/s) due to the similar clock and architecture:
32000 atoms: 219.8 katom-step/s
64000 atoms: 222.5 katom-step/s
128000 atoms: 216.8 katom-step/s
256000 atoms: 221.0 katom-step/s
864000 atoms: 221.1 katom-step/s
Switching to an older Intel Xeon E5-2650 v4 CPU (12 cores, 12 threads, base clock 2.2GHz, max. clock 2.9GHz, L1/L2/L3 cache (64kB/256kB/30MB, 4 DDR4-2400 memory channels) leads to a lower performance of approximately 109 katom-step/s due to differences in architecture and clock. In all cases, when looking at multiple runs, the katom-step/s property fluctuates by approximately 1% around the average.
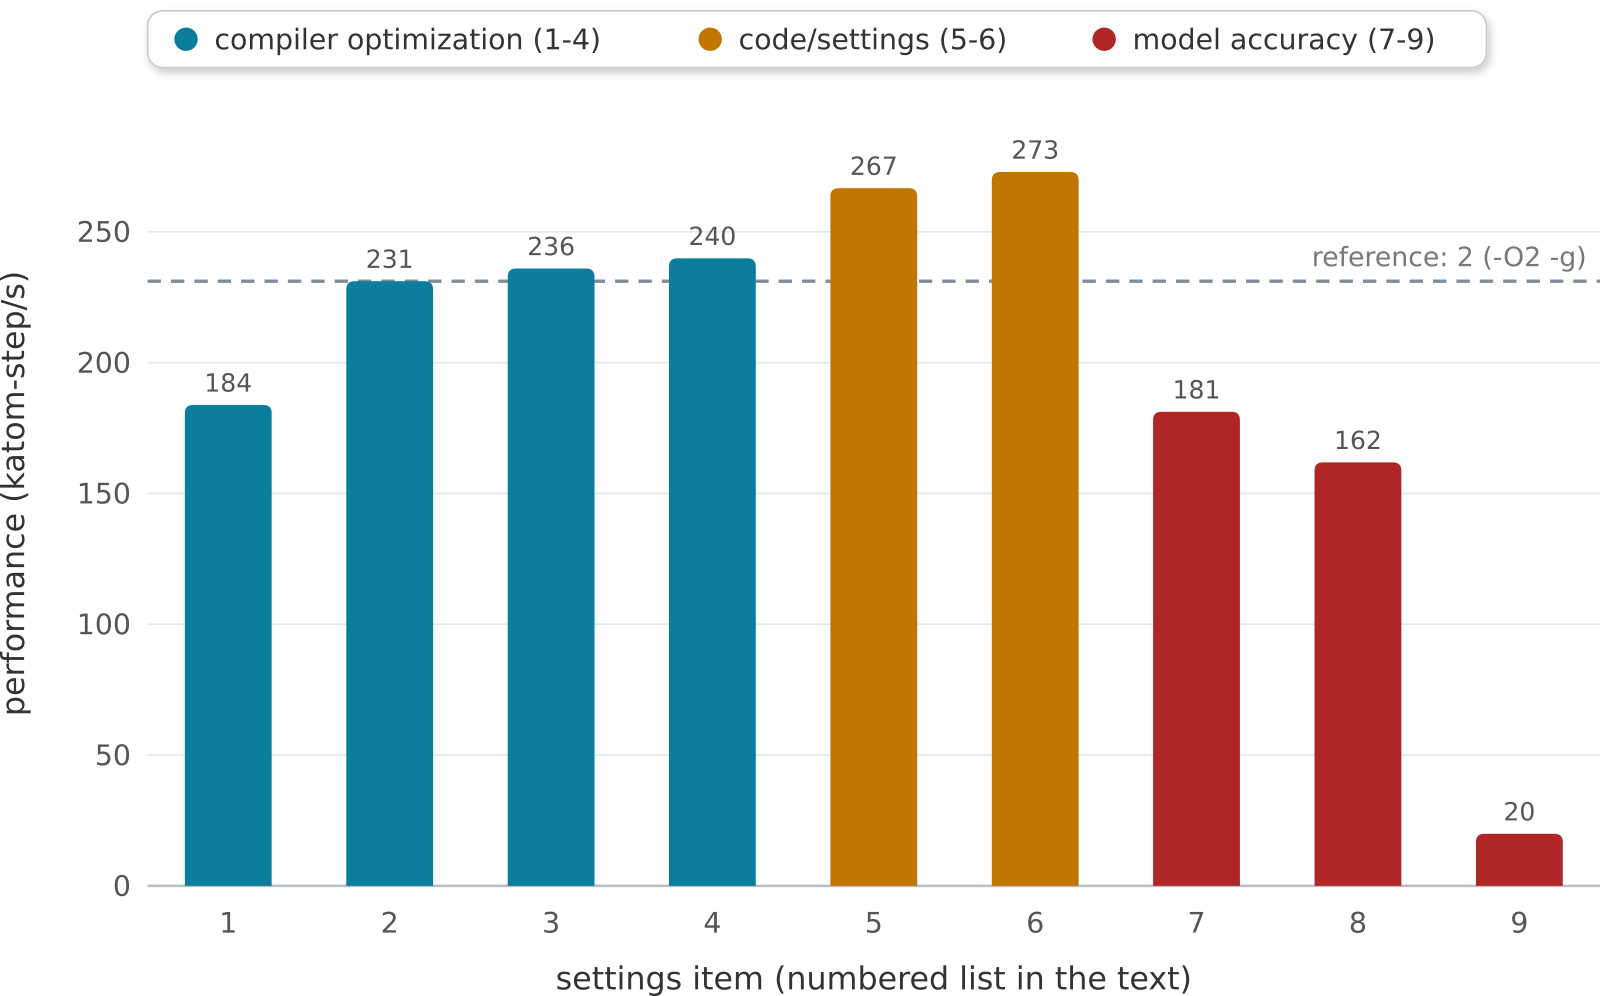
From here on we are looking at the performance for the 256000 atom system only and change several settings incrementally:
No compiler optimization GCC (-Og -g): 183.8 katom-step/s
Moderate optimization with debug info GCC (-O2 -g): 231.1 katom-step/s
Full compiler optimization GCC (-DNDEBUG -O3): 236.0 katom-step/s
Aggressive compiler optimization GCC (-O3 -ffast-math -march=native): 239.9 katom-step/s
Source code optimization in OPENMP package (1 thread): 266.7 katom-step/s
Use fix nvt instead of fix npt (compute virial only every 50 steps): 272.9 katom-step/s
Increase pair style cutoff by 2 \(\AA\): 181.2 katom-step/s
Use tight PPPM convergence (1.0e-6 instead of 1.0e-4): 161.9 katom-step/s
Use Ewald summation instead of PPPM (at 1.0e-4 convergence): 19.9 katom-step/s
The numbers show that gains from aggressive compiler optimizations are rather small in LAMMPS, the data access optimizations in the OPENMP (and OPT) packages are more prominent. On the other side, using more accurate force field settings causes, not unexpectedly, a significant slowdown (to about half the speed). Finally, using regular Ewald summation causes a massive slowdown due to the bad algorithmic scaling with system size.

7.2.3. Examples comparing parallel performance
The parallel performance usually goes on top of the serial performance. Using twice as many processors should increase the performance metric by up to a factor of two. With the number of processors N and the serial performance \(p_1\) and the performance for N processors \(p_N\) we can define a parallel efficiency in percent as follows:
For the AMD Ryzen Threadripper PRO 9985WX CPU and the serial simulation settings of point 6. from above, we get the following parallel efficiency data for the 256000 atom system:
1 MPI task: 273.6 katom-step/s, \(P_{eff} = 100\%\)
2 MPI tasks: 530.6 katom-step/s, \(P_{eff} = 97\%\)
4 MPI tasks: 1.021 Matom-step/s, \(P_{eff} = 93\%\)
8 MPI tasks: 1.837 Matom-step/s, \(P_{eff} = 84\%\)
16 MPI tasks: 3.574 Matom-step/s, \(P_{eff} = 82\%\)
32 MPI tasks: 6.479 Matom-step/s, \(P_{eff} = 74\%\)
64 MPI tasks: 9.032 Matom-step/s, \(P_{eff} = 52\%\)
128 MPI tasks: 12.03 Matom-step/s, \(P_{eff} = 34\%\)
The 128 MPI tasks run uses CPU cores from hyper-threading.
For a small system with only 32000 atoms the parallel efficiency drops off earlier when the number of work units is too small relative to the communication overhead:
1 MPI task: 270.8 katom-step/s, \(P_{eff} = 100\%\)
2 MPI tasks: 529.3 katom-step/s, \(P_{eff} = 98\%\)
4 MPI tasks: 989.8 katom-step/s, \(P_{eff} = 91\%\)
8 MPI tasks: 1.832 Matom-step/s, \(P_{eff} = 85\%\)
16 MPI tasks: 3.463 Matom-step/s, \(P_{eff} = 80\%\)
32 MPI tasks: 5.970 Matom-step/s, \(P_{eff} = 69\%\)
64 MPI tasks: 7.477 Matom-step/s, \(P_{eff} = 42\%\)
128 MPI tasks: 8.069 Matom-step/s, \(P_{eff} = 23\%\)
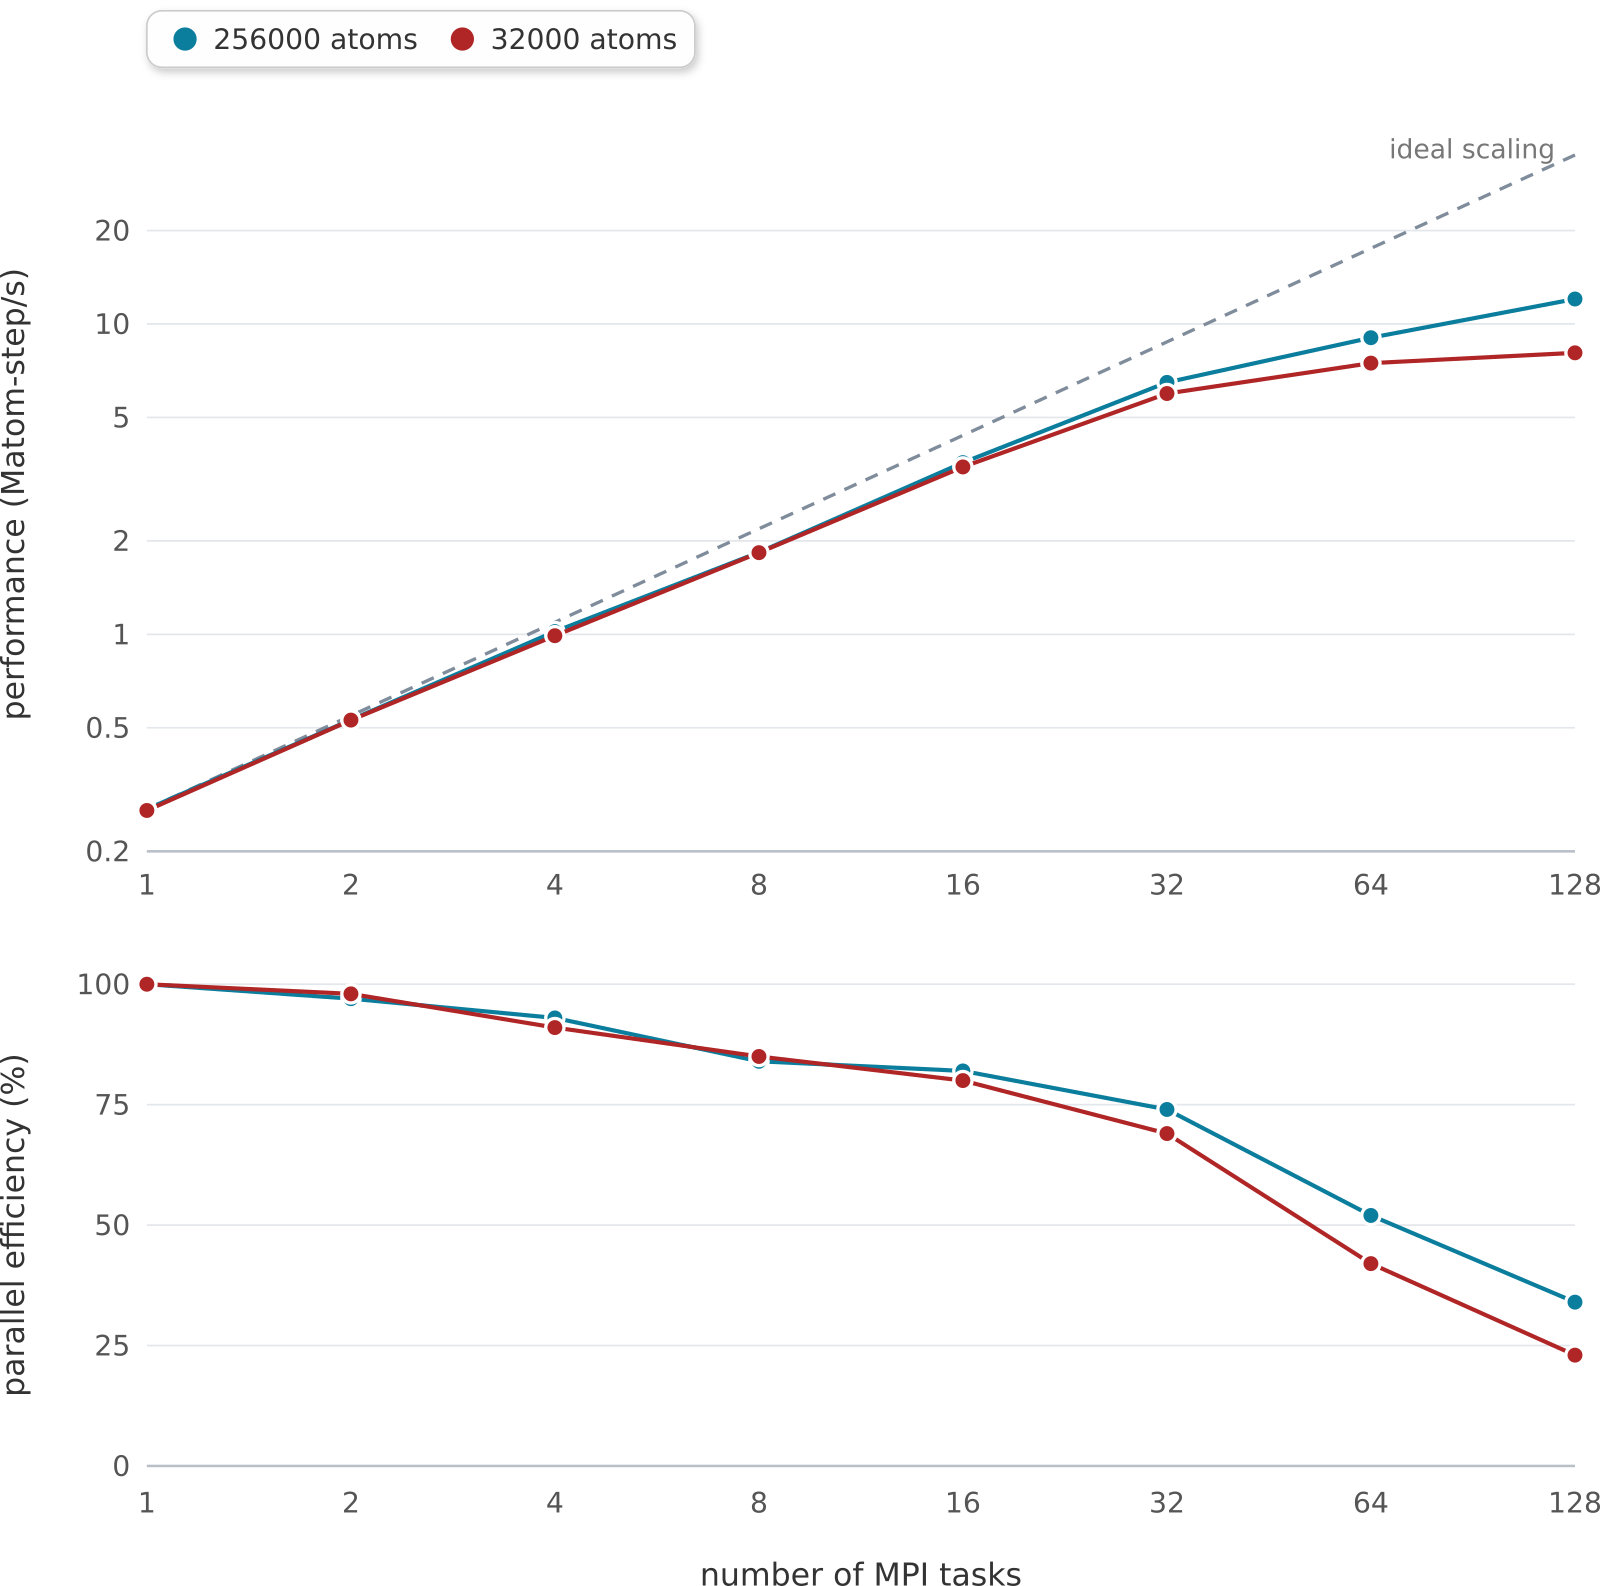
Parallel scaling of the two data sets above on the AMD Ryzen Threadripper PRO 9985WX: absolute performance compared to ideal linear scaling (top, double-logarithmic scale) and the corresponding parallel efficiency (bottom). The smaller system drops off earlier because its number of work units per MPI task is smaller relative to the communication overhead; the 128-task data points use hyper-threading (the CPU has 64 physical cores).
7.2.4. Measuring performance of your input deck
The best way to do this is run the your system (actual number of atoms) for a modest number of timesteps (say 100 steps) on several different processor counts, including a single processor if possible. Do this for an equilibrium version of your system, so that the 100-step timings are representative of a much longer run. There is typically no need to run for 1000s of timesteps to get accurate timings; you can simply extrapolate from short runs.
For the set of runs, look at the timing data printed to the screen and log file at the end of each LAMMPS run. The screen and logfile output page gives an overview.
Running on one (or a few processors) should give a good estimate of the serial performance and what portions of the timestep are taking the most time. Running the same problem on a few different processor counts should give an estimate of parallel scalability. I.e. if the simulation runs 16x faster on 16 processors, its 100% parallel efficient; if it runs 8x faster on 16 processors, it’s 50% efficient.
The most important data to look at in the timing info is the timing breakdown and relative percentages. For example, trying different options for speeding up the long-range solvers will have little impact if they only consume 10% of the run time. If the pairwise time is dominating, you may want to look at GPU or OMP versions of the pair style, as discussed below. Comparing how the percentages change as you increase the processor count gives you a sense of how different operations within the timestep are scaling. If you are using PPPM as Kspace solver, you can turn on an additional output with kspace_modify fftbench yes which measures the time spent during PPPM on the 3d FFTs, which can be communication intensive for larger processor counts. This provides an indication whether it is worth trying out alternatives to the default FFT settings for additional performance.
Another important detail in the timing info are the histograms of atoms counts and neighbor counts. If these vary widely across processors, you have a load-imbalance issue. This often results in inaccurate relative timing data, because processors have to wait when communication occurs for other processors to catch up. Thus the reported times for “Communication” or “Other” may be higher than they really are, due to load-imbalance. If this is an issue, you can use the timer sync command to obtain synchronized timings.